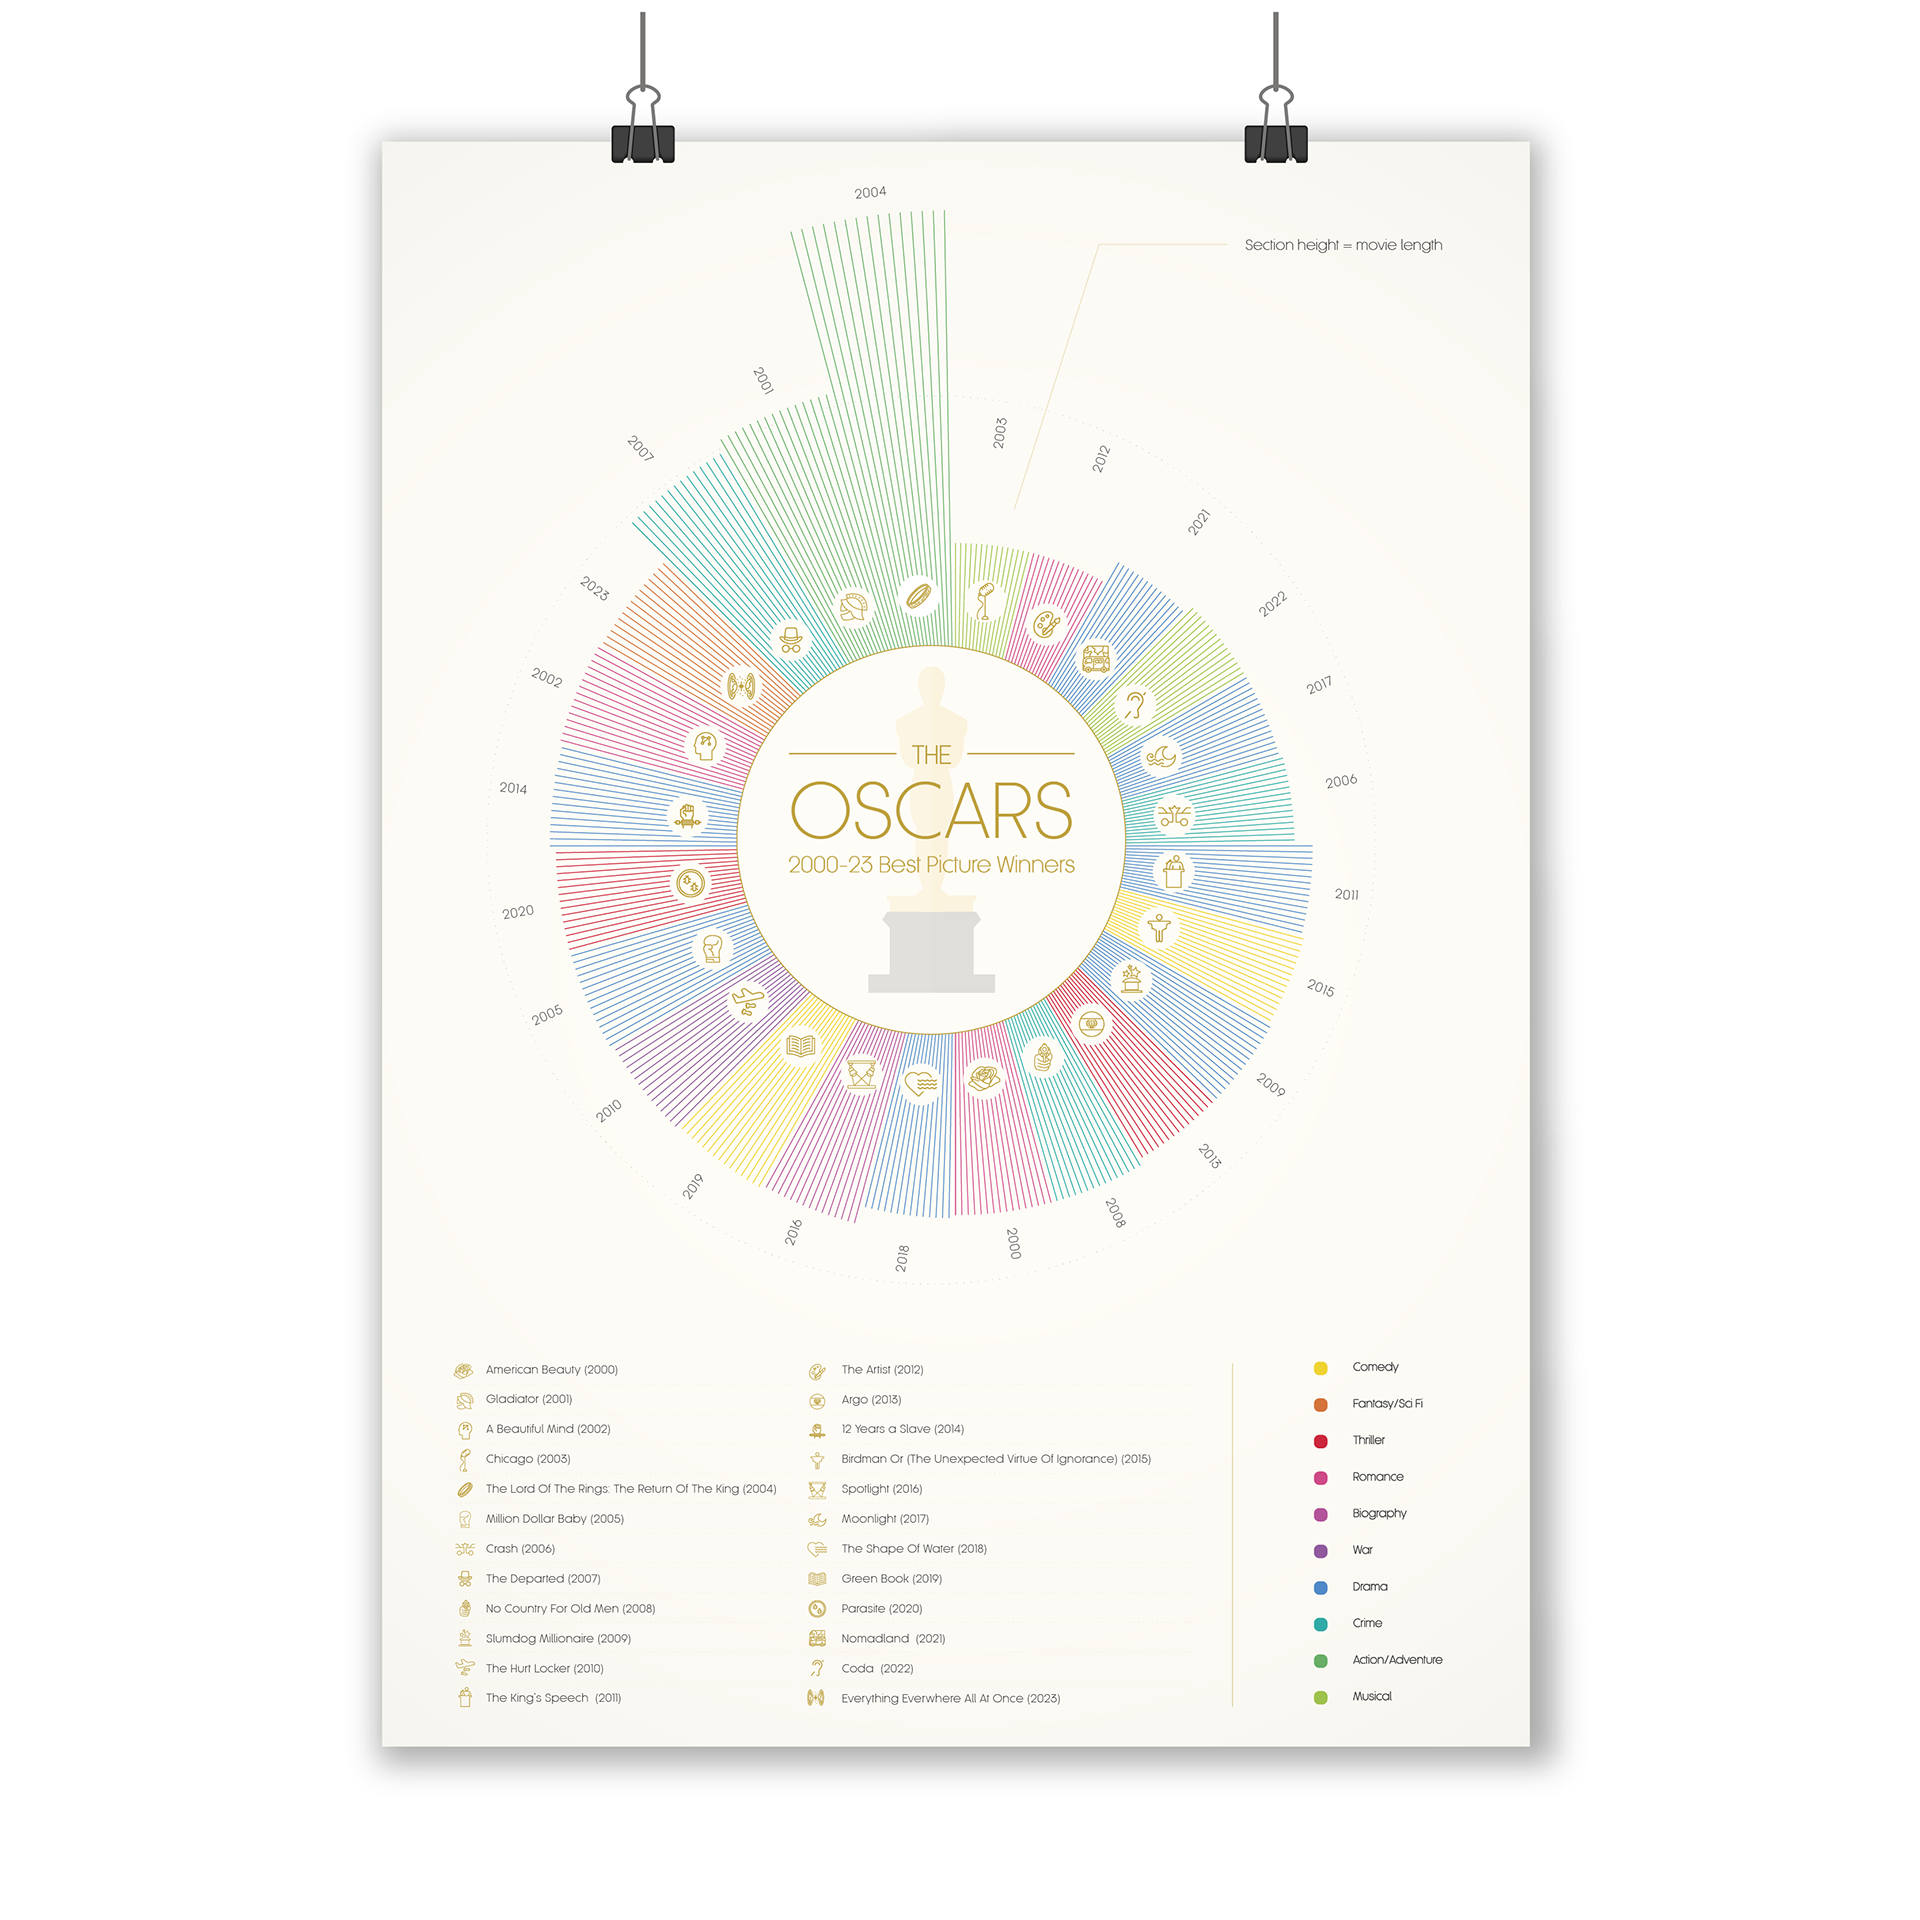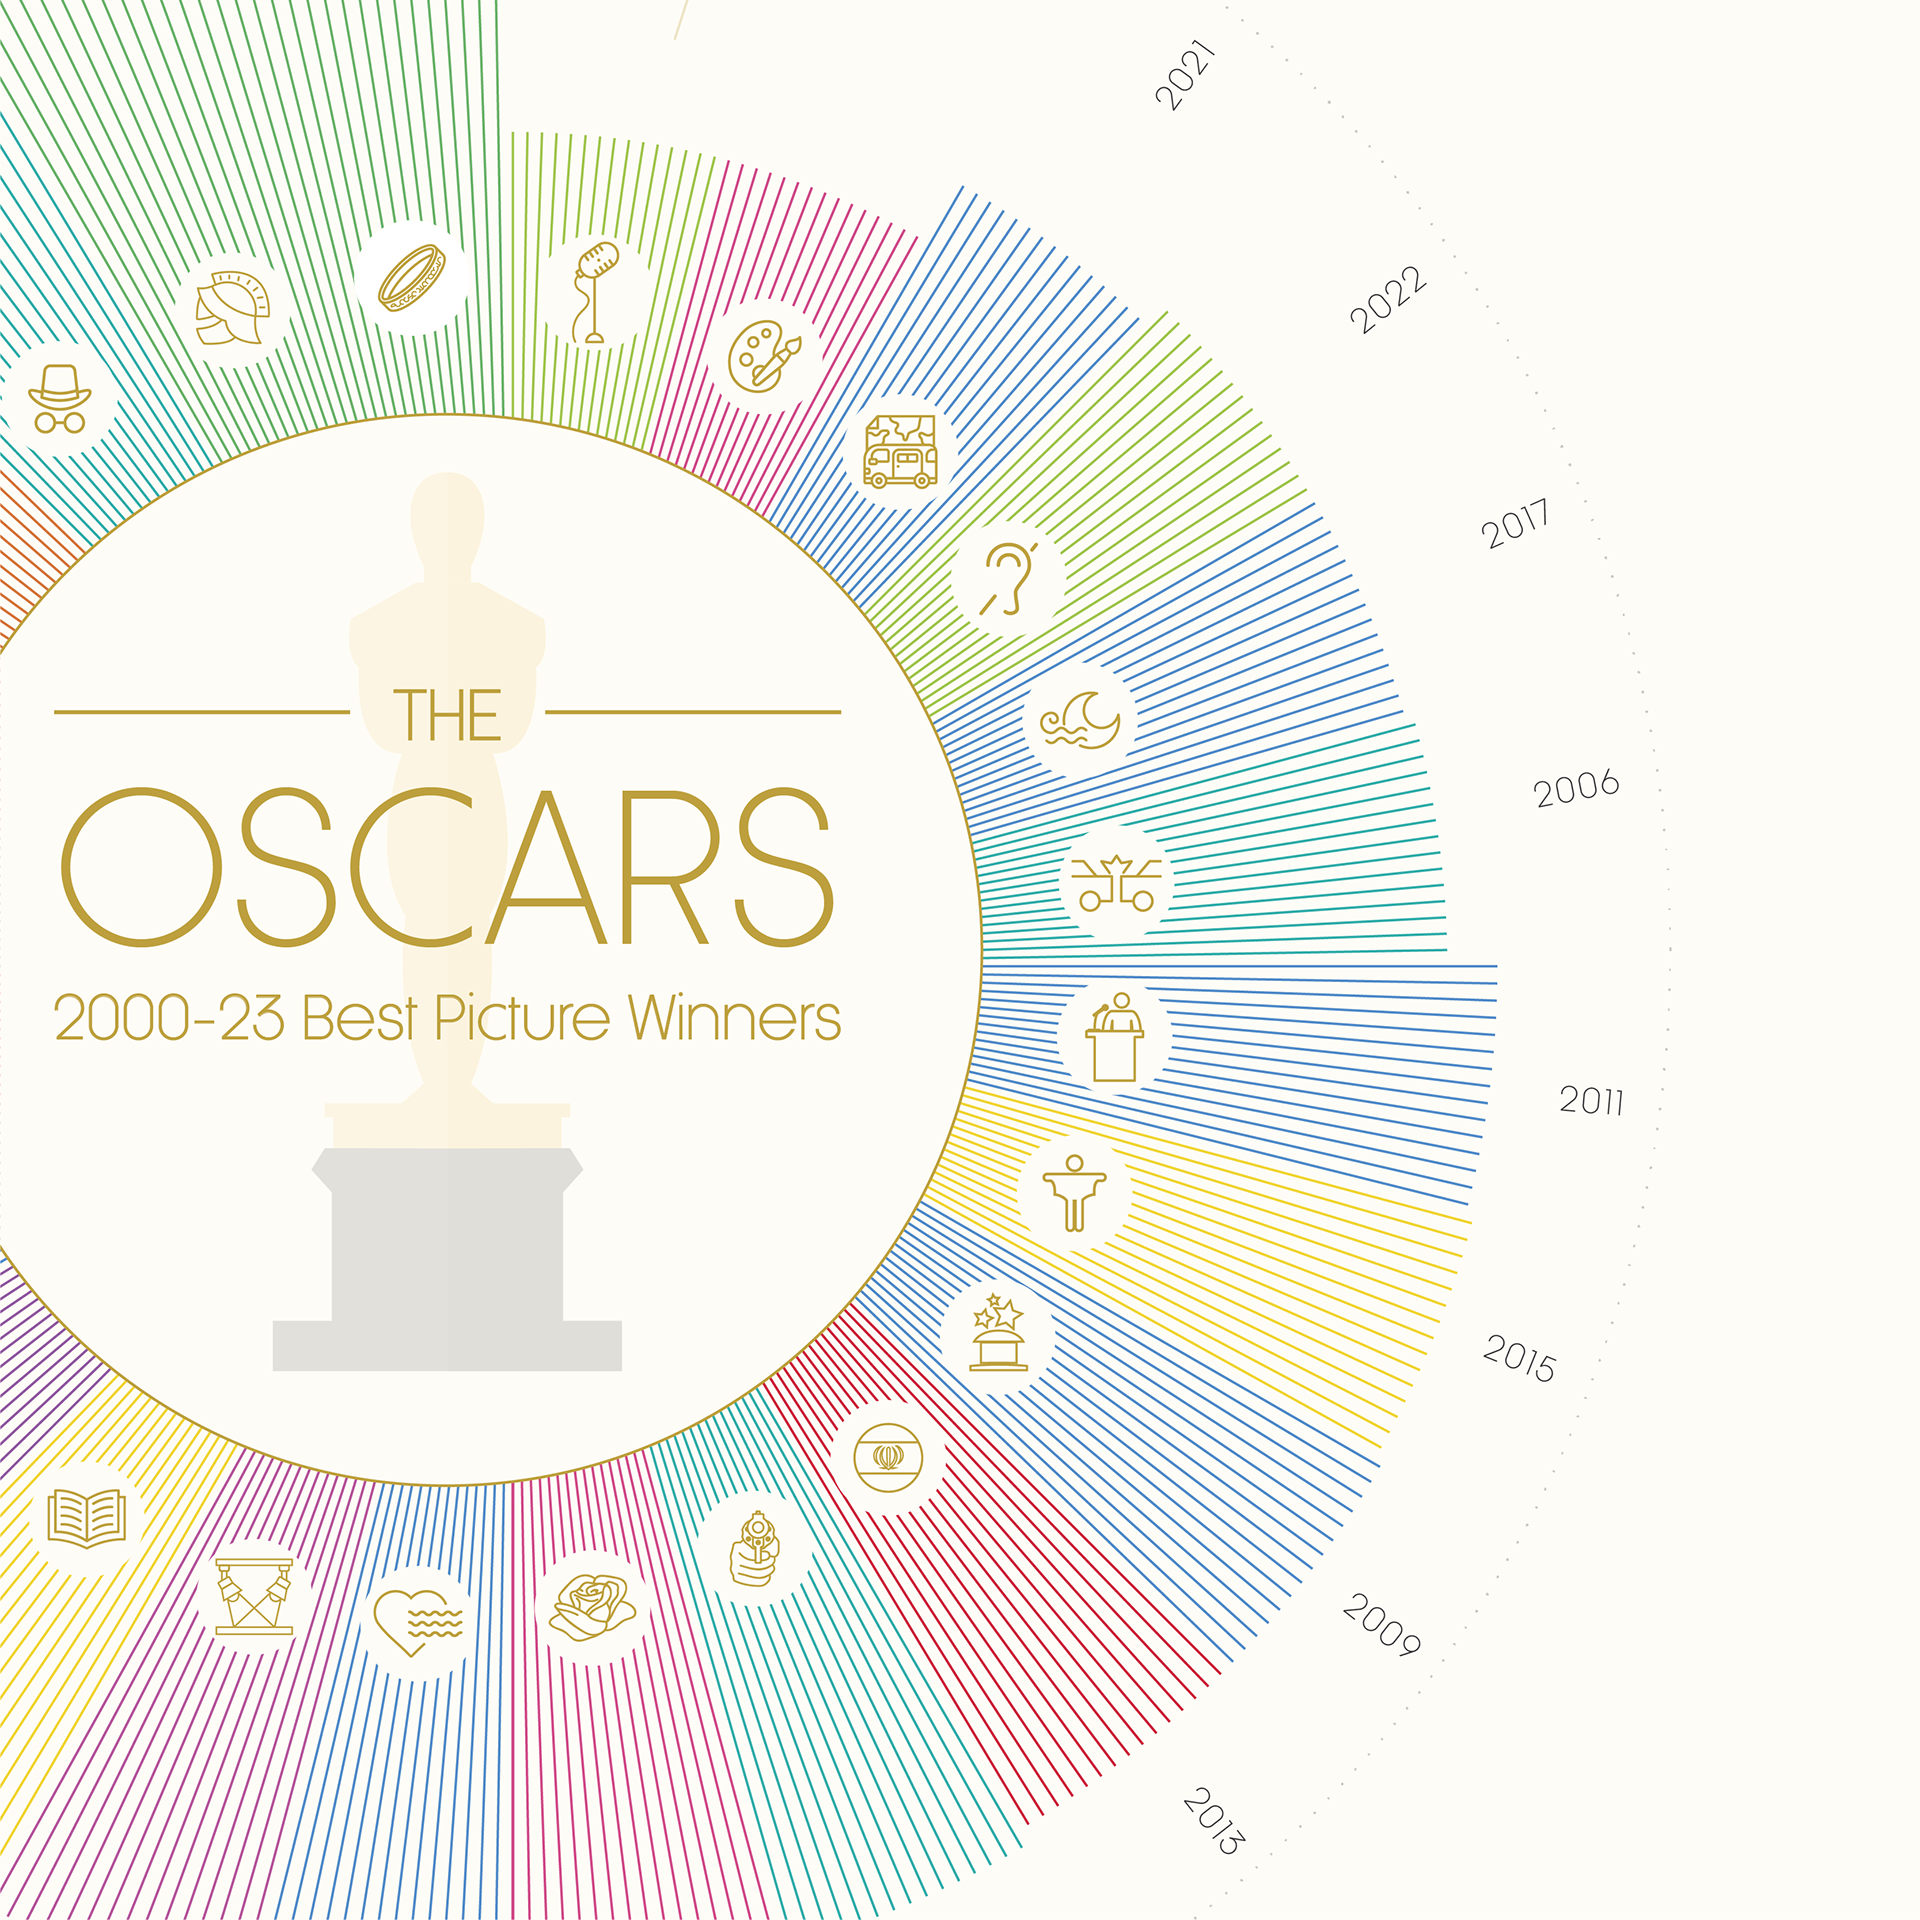

The infographic uses data visualisation techniques to represent the Oscars 'Best Picture' winners since 2000.
In this project, figures and statistics are represented by colours, line length and icons. The infographic demonstrates how data can be represented in a visually appealing format, more accessible to general audiences.